
Debugging production is bad. Even access to production is bad. But debugging production is evil. I even cannot describe how evil I think it is. But if you ask most developers (including myself), they will say that this can be useful. Up to last week, I thought it cannot be done in safety way, but a new feature in Application Insights called Snapshot collector.
What does it mean?
Requirements
- Application Insights must be turned on for your application (obvious)
- Microsoft.ApplicationInsights.SnapshotCollector must be installed and configure (default should do the job) in your application
- PDB files can be useful, to preview errors.
Deploy and test
Now you are ready to create a deploy and generate an exception. Not every exception is dumped and it is a default threshold set to 5. When you generate enough exceptions there will be a new button in the Azure portal in Application Insights failures sections. To get there go to Your Application Insights instance -> Failures -> Total of Server exceptions by Problem Id -> Select interesting exception and you will see the exception details

If you have PDB on your server you can preview lines. Moreover, you can deselect the Show Just My Code option to see full stack. Now we are ready to click the Open Debug Snapshot button.
Using portal
In the portal, there is more than you can expect and it is for free. We can preview call stack with details and local variables. Fair enough to diagnose problems. Of course, some variables cannot be evaluated. My exception happened in below code:
1
2
3
4
5
6
7
8
9
10
11
12
13
14
15
16
17
18
19
20
21
22
private IEnumerable<string> SetupUmbracoRoles(ClaimsIdentity user)
{
  var email = user.FindFirst(ClaimTypes.Name).Value;
  var userService = ApplicationContext.Current.Services.UserService;
  var umbraUser = userService.GetByEmail(email);
  var userGroups = user.FindAll("groups");
  var rolesList = userGroups as IList<Claim> ?? userGroups.ToList();
  var admin = rolesList.Any(r => r.Value == AzureADGroupNames.CorpoBlogAdmin);
  if (!admin && !rolesList.Any(r => r.Value == AzureADGroupNames.CorpoBlogEditors))
  {
      if (umbraUser != null)
      {
          umbraUser.AllowedSections.ToList().ForEach(s => umbraUser.RemoveAllowedSection(s));
          umbraUser.UserType = userService.GetUserTypeByAlias(UmbracoRoleNames.Translator);
          userService.Save(umbraUser);
      }
      telemetry.TrackEvent("unauthorized acces", new Dictionary<string, string>() { { "user", email } });
      throw new HttpException(403, "You do not have any roles configured for the application");
  }

  //Rest of the code
}
For above the Debug Snapshot view looks like following

As you can see for some variables it cannot obtain the value. The reason is simple: Cannot obtain value of the local variable or argument because it is not available at this instruction pointer, possibly because it has been optimized away.
Except that it is really useful, especially that you can navigate through the whole stack.
Open snapshot in Visual Studio
That’s sound interesting, but there are two additional requirements:
- Visual Studio 2017 Enterprise installed, but it can be one in the whole company
- Visual Studio Snapshot Debugger extension installed
Now we are ready to download a snapshot. In my case, it is around 175MB. And such snapshot is stored in the application insights. I suggest opening the dump inside the project you are debugging. Then click proper debug option and how fun

My exception looks like following:

To be precise the only advantage of downloading the snapshot into Visual Studio is that you can download additional PDB files, which aren’t available in the Azure portal.
Common problems
If you have more problems, please let me know I will add them here:
- Exception count doesn’t exceed the threshold. There is a default value set to 5, which means that at least you have to generate more than 5 exceptions to get the dump. In my case, it was the seventh try, don’t ask me why.
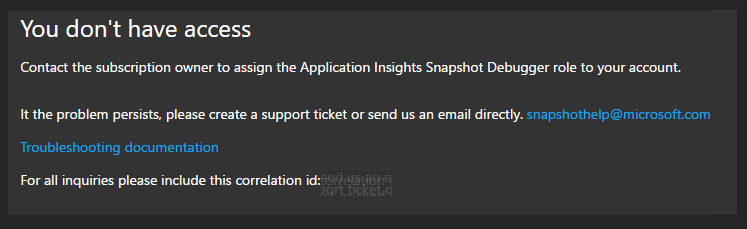
- You haven’t an Application Insights Snapshot Debugger role. If you are a subscription master/owner/admin/god the proper window will appear and you can add it instantly. Otherwise, you will see:
![]()
Is possible to debug production safety?
Using the snapshot debugger with its limitations, the answer is yes. Futhermore I will have to check more limits, configuration, etc to make it more powerful. But I’m sure that I will use it.