What’s going on?
Every week my team is trying to check our bill for Azure. This week OMS won the battle. We have a small AKS cluster, and logs are one of the most expensive part of it.
1
2
3
4
5
Usage
| where TimeGenerated > startofday(ago(7d))
| where IsBillable == true
| summarize TotalVolumeGB = sum(Quantity) / 1000 by bin(TimeGenerated, 1d), Solution
| render barchart
The result is following:
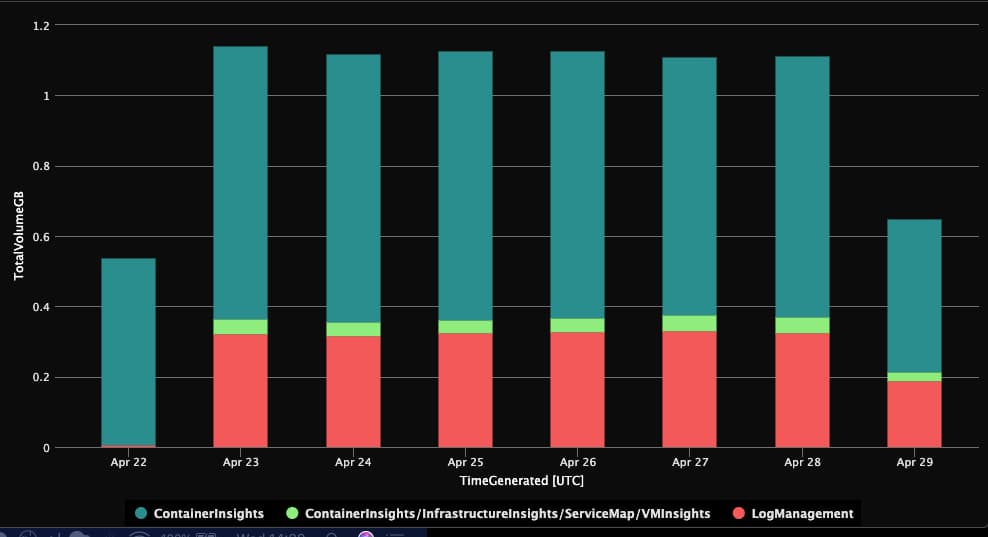
What does it mean? In our case we have:
- a lot of Log Managment
- a lot of Container Insights
Let’s step in one more level so the query is following.
1
2
3
4
5
Usage
| where TimeGenerated > startofday(ago(7d))
| where IsBillable == true
| summarize TotalVolumeGB = sum(Quantity) / 1000 by bin(TimeGenerated, 1d), DataType, Solution
| render barchart
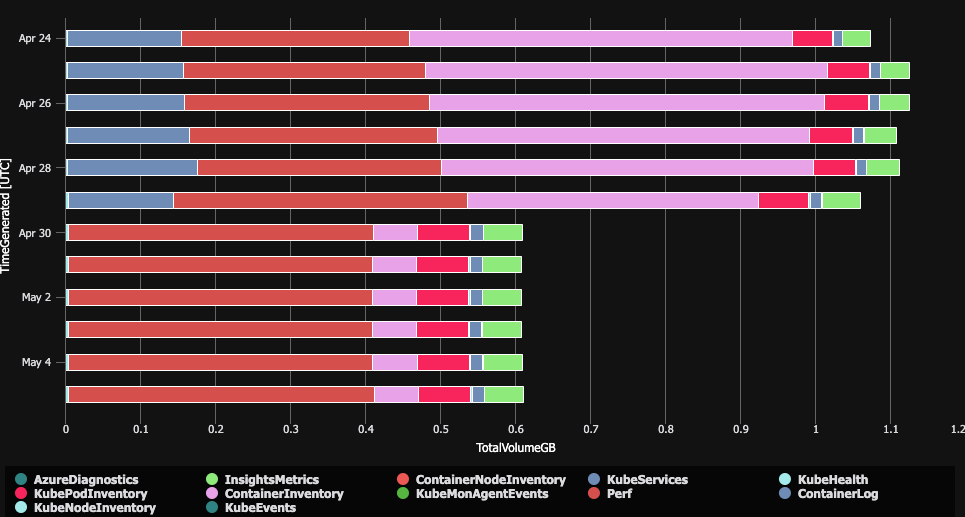
And the result looks like below. 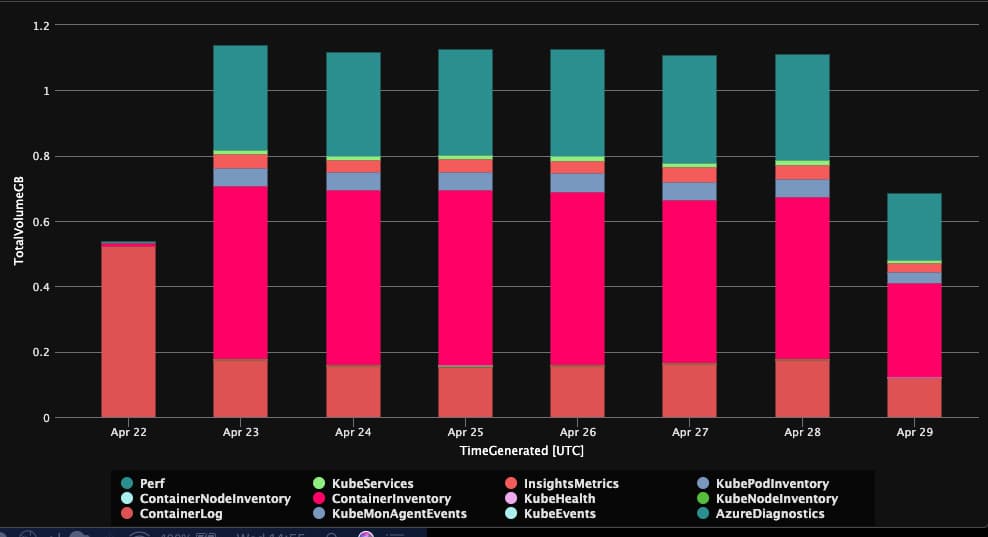
Who is guilty?
- Container Log
- Container Inventory
- Perf
Container log
This category is easy. It is logs from stdout and stderr. If you want to find which namespaces are generating too much logs you can use:
1
2
3
4
5
6
7
8
9
10
11
12
13
let startTime = ago(1h);
let containerLogs = ContainerLog
| where TimeGenerated > startTime
| where _IsBillable == true
| summarize BillableDataMBytes = sum(_BilledSize)/ (1000. * 1000.) by LogEntrySource, ContainerID;
let kpi = KubePodInventory
| where TimeGenerated > startTime
| distinct ContainerID, Namespace, ControllerName;
containerLogs
| join kpi on $left.ContainerID == $right.ContainerID
| extend sourceNamespace = strcat(LogEntrySource,"/", Namespace)
| summarize MB=sum(BillableDataMBytes) by sourceNamespace
| render piechart
And for pods (bewear for used regex):
1
2
3
4
5
6
7
8
9
10
11
12
13
let startTime = ago(1h);
let containerLogs = ContainerLog
| where TimeGenerated > startTime
| where _IsBillable == true
| summarize BillableDataMBytes = sum(_BilledSize)/ (1000. * 1000.) by LogEntrySource, ContainerID;
let kpi = KubePodInventory
| where TimeGenerated > startTime
| distinct ContainerID, Namespace, ControllerName;
containerLogs
| join kpi on $left.ContainerID == $right.ContainerID
| extend sourceNamespace = strcat(LogEntrySource,"/", Namespace, "/", extract("(.*)-.*", 1,ControllerName))
| summarize MB=sum(BillableDataMBytes) by sourceNamespace
| render piechart
In my case the biggest problem was with Ingress, but to be fair I don’t need this logs at all. Why? Because my apps already flush everything to application insights.
Before fixing, let’s see what else is in the logs!
Container Inventory
The second part was Container Inventory. As you look through it, every minute every container logs state + environment variables. What are the size of it last week? Let’s check it out!
1
2
3
ContainerInventory
| where TimeGenerated > ago(7h)
| summarize size = sum(string_size(EnvironmentVar)) / (1000. * 1000.)
In my case it was 2GB in last week. Yes 2GB of env variables. By the way, the secretes are there too!
Perf - last but not least
First the query to checkout what in it.
1
2
3
4
Perf
| where TimeGenerated > ago(10m)
| summarize count(), BilledSizeKb=bin(sum(_BilledSize)/1024.0, 1) by Computer, bin(TimeGenerated, 1m)
| order by TimeGenerated asc
Every instance logs a lot and if we drill in there are a lot of important things in it. Maybe somehow I can reduce it by half?
Check OMS Agent
Let’s see what’s going on in OMS agent. The easiest way is to get YAML with autocomplete:
1
kubectl get po -n kube-system omsagent-rs-<TAB><TAB> -o yaml
So we can find out that it optionaly loads config map:
1
2
3
4
  - configMap:
      defaultMode: 420
      name: container-azm-ms-agentconfig
      optional: true
Quick search and probably you will find the official docs and the default file
As you can see we can remove stdout and stderr easy, the same with env variables. Just take a look. I removed comments to make it clear.
1
2
3
4
5
6
7
8
9
   [log_collection_settings]
       [log_collection_settings.stdout]
          enabled = false
          exclude_namespaces = ["kube-system"]
       [log_collection_settings.stderr]
          enabled = false
          exclude_namespaces = ["kube-system"]
       [log_collection_settings.env_var]
          enabled = false
After few hours we can verify results. The first query for Container Inventory is bellow.
1
2
3
4
ContainerInventory
| where TimeGenerated > ago(24h)
| summarize size = sum(string_size(EnvironmentVar)) / (1000. * 1000.) by bin(TimeGenerated, 1h)
| order by TimeGenerated asc
Results are just awesome. Before the size was around 22.0, now it is 0.17, so it is 100th smaller.
The same is with prometheus data. We can just change interval with following settings.
1
2
    [prometheus_data_collection_settings.cluster]
        interval = "1m"
And
1
2
    [prometheus_data_collection_settings.node]
        interval = "1m"
I’m not using OMS scraping for Prometheus, so it won’t help in my case at all.
Perf - table
For perf table we have to wait. You can find following code:
1
2
3
4
5
6
7
# Kubernetes perf
<source>
type kubeperf
tag oms.api.KubePerf
run_interval 60s
log_level debug
</source>
But this doesn’t work. And we have to wait until AKS team gives us possibility to tune settings.
Sum up
I saved a lot of data, just checkout following diagram: